




Reading the FTSE MIB: A Local Guide to Italy's Blue-Chip Index
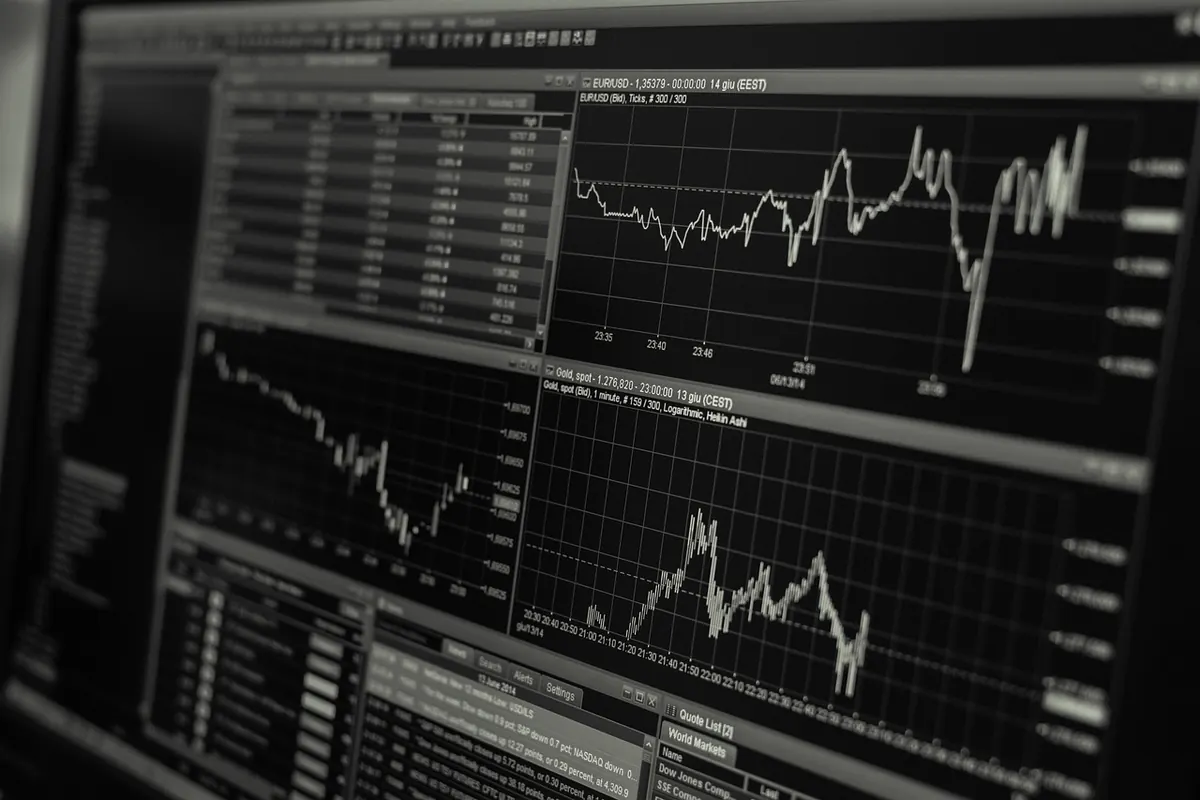
Watch a Milan trading screen for a morning and you notice something: the FTSE MIB rarely drifts. It lurches. A headline from Frankfurt, a Bank of Italy auction result, a Chinese consumer-sentiment number — any of them can move the index by a percent before the coffee goes cold. That volatility is not noise. It is the index telling you what it is made of: a concentrated basket of large Italian companies with heavy exposure to interest rates, government debt and the global luxury cycle. Once you know its wiring, the daily swings stop looking random.
What the FTSE MIB actually measures
The FTSE MIB is the headline benchmark of Borsa Italiana, the Milan exchange owned by Euronext. It tracks 40 of the largest and most liquid companies listed there, weighted by free-float market capitalisation — the portion of shares genuinely available to trade, not a founding family's stake or a state holding. The index launched in June 2009, replacing the old S&P/MIB, and it is calculated by FTSE Russell. On a terminal you will see it as FTSEMIB; the futures contract trades on Euronext's IDEM derivatives market.
Two mechanical details matter more than newcomers expect. First, the headline number is a price index, so it excludes dividends. Italian blue chips are historically generous payers, which means a total-return version of the same basket can look considerably healthier over a decade than the price chart suggests. Second, individual weights are capped, so no single company can swallow the index whole. Caps keep concentration in check — they do not make it disappear.
The sector map: banks, energy, and a slice of luxury
Financials are typically the largest block, and not by a small margin. Intesa Sanpaolo, UniCredit, Generali, Banco BPM, BPER, Mediobanca and Unipol sit at the centre of the index, with Poste Italiane straddling insurance and payments. Energy and utilities form the second pillar: Eni, Enel, Snam and Terna. Industrials contribute Leonardo, Prysmian and Interpump; healthcare brings Recordati, Diasorin and Amplifon; consumer names include Stellantis, Ferrari, Moncler, Brunello Cucinelli and Campari.
Then look at what is missing. Technology is thin. There is no Italian equivalent of SAP or ASML anchoring the top of the index. That single absence explains a lot about how the FTSE MIB behaves relative to the DAX or the S&P 500 — it is a cyclical, rate-sensitive, dividend-heavy index with a luxury chaser, not a growth index.
Where the concentration bites
Because the top ten names carry a large share of the index, a handful of stocks explain most of any given session. A strong day for two big banks can lift the index while the median constituent is flat or lower. That divergence is worth checking: if the headline is up 1% but breadth is negative, the move is a bet on financials, not a broad vote of confidence in Italy.
Why the spread matters more than you think
The BTP–Bund spread — the yield gap between Italian and German ten-year government bonds — functions as the index's local risk barometer. There is a mechanical reason. Italian banks hold substantial amounts of domestic sovereign debt on their balance sheets, so a widening spread hits both sovereign valuations and bank capital at the same time. When the spread jumps, the FTSE MIB usually underperforms its European peers within minutes, and the bank sub-sector leads the fall.
Interest rates cut both ways. Italian lenders earned unusually wide net interest margins during the high-rate period, so a rapid easing cycle can pressure bank earnings even as it helps indebted corporates. Meanwhile utilities such as Enel and Terna, which carry heavy debt loads, tend to welcome falling yields. A single ECB decision therefore pushes different parts of the index in opposite directions — which is why the headline number sometimes barely moves while the internals churn.
Reading a daily move: six questions
Before drawing conclusions from a red or green screen, run through this sequence. It takes two minutes and saves a lot of bad interpretation.
- Is all of Europe moving? Compare with the Euro Stoxx 50, the DAX and the CAC 40. If they are down in tandem, you are watching a European or global story, not an Italian one.
- What did Wall Street leave behind? Overnight US closes and futures set the tone for Milan's afternoon session.
- Did the spread move? A wider BTP–Bund gap alongside a falling index points to domestic risk repricing.
- Which sector led? Banks leading means rates and sovereign risk. Luxury and autos leading means China, tariffs or currency.
- Is there a single-stock story? Profit warnings, dividend surprises and M&A speculation in a heavyweight can outweigh macro news.
- Where is the euro? A stronger euro flatters importers and squeezes exporters, and luxury groups earn most of their revenue abroad.
Access for global investors
For most foreign investors the FTSE MIB is a satellite position, not a core holding. Exposure is straightforward: index ETFs listed in Milan, London, Frankfurt or New York, or futures and options on IDEM for those hedging or trading tactically. Single-stock liquidity is concentrated at the top — the largest names trade comfortably, while smaller constituents can be awkward to build or exit in size. Currency matters too: an unhedged euro exposure sits on top of the equity risk, and for a dollar-based investor the euro's moves can quietly dominate a year's return.
Think of the index in functional terms. It is a relatively pure play on European bank profitability, a leveraged expression of Italian sovereign risk, and a cyclical bet on luxury demand from Asia. Used that way it earns its place in a portfolio. Treat it as a broad proxy for Italian economic growth and it will mislead you, because the domestic economy and the index's global earners are not the same thing. As with any allocation, if real money is involved, a licensed adviser should review the currency and concentration risks with you.
A practical closing checklist
- Note the level, the percentage change, and whether the move exceeds the index's recent average daily range.
- Check breadth: are more constituents up or down than the headline implies?
- Confirm the BTP–Bund spread and the euro are quiet, or account for them.
- Identify the two or three heaviest movers and whether their news is company-specific or sector-wide.
- Compare against the DAX and CAC to separate Italian news from European drift.
- Remember dividends when judging long-run performance, and use the total-return series for any multi-year comparison.
Do that consistently and the FTSE MIB stops being a mysterious, jumpy number at the bottom of a screen. It becomes a readable gauge of Italian banks, European rates and global luxury appetite — three forces that rarely agree, which is precisely why the index moves the way it does.
Photo: 3844328 / Pixabay